Usage, Quota & Spend Tracking
TL;DR: OmniRoute tracks every request’s token usage, computes cost, enforces per-API-key quota, and surfaces analytics in the dashboard. This guide explains how it all works.
Sources:
open-sse/services/usage.ts(~70KB) — main usage trackingsrc/lib/usageAnalytics.ts(~10KB) — aggregation for dashboardsrc/lib/db/quotaSnapshots.ts— historical quota datasrc/lib/db/usage*.ts— multiple usage-related DB modules
Overview
Section titled “Overview”Every request that flows through OmniRoute generates a usage record that captures:
- Identity: which API key, provider, model, combo
- Tokens: prompt tokens, completion tokens, cached tokens, total
- Cost: USD amount (computed from pricing data)
- Timing: latency, start/end timestamps
- Status: success, error, rate-limited, etc.
These records are aggregated into analytics, persisted as quota snapshots, and used to enforce per-key budget limits.
Request ──▶ chatCore ──▶ usage.record() ──▶ SQLite │ ┌───────┼───────┐ ▼ ▼ ▼ analytics quota billing (dashboard) (enforce) (export)What Gets Recorded
Section titled “What Gets Recorded”The usage.ts service captures a usage event for every request:
| Field | Type | Source |
|---|---|---|
id |
string | UUID generated on record |
apiKeyId |
string | The API key that initiated the request |
provider |
string | Provider ID (openai, anthropic, etc.) |
model |
string | Model ID (gpt-5, claude-opus-4-6, etc.) |
comboId |
string? | Combo ID if routed through a combo |
promptTokens |
number | From upstream response |
completionTokens |
number | From upstream response |
cachedTokens |
number | Cache hit tokens (Anthropic prompt caching, etc.) |
totalTokens |
number | prompt + completion |
costUsd |
number | Computed from pricing data |
latencyMs |
number | End-to-end request duration |
status |
enum | success, error, rate_limited, timeout, cancelled |
errorClass |
string? | Error class if status != success |
timestamp |
string | ISO 8601 UTC |
metadata |
object | Custom plugin-injected data |
Where Tokens Come From
Section titled “Where Tokens Come From”Tokens are extracted from the upstream provider’s response in the response handler:
// From open-sse/handlers/chatCore.tsconst response = await providerExecutor.execute(provider, request);const usage = response.usage || { prompt_tokens: 0, completion_tokens: 0, cached_tokens: 0,};For providers that don’t return usage (some web-cookie providers), OmniRoute estimates tokens using a ~4 chars per token heuristic (see open-sse/services/autoCombo/pipelineRouter.ts).
Cached Tokens
Section titled “Cached Tokens”OmniRoute tracks cached_tokens separately from prompt_tokens because:
- Anthropic prompt caching charges a reduced rate for cached tokens (10% of normal)
- Some providers return
cache_read_input_tokensthat should be priced differently - Analytics can show the cache hit rate =
cached_tokens / prompt_tokens
Cost Calculation
Section titled “Cost Calculation”Costs are computed from pricing data synced from LiteLLM (src/lib/pricingSync.ts):
| Model | Input $/1M | Output $/1M | Cached $/1M |
|---|---|---|---|
| gpt-5 | $2.50 | $10.00 | — |
| claude-opus-4-6 | $15.00 | $75.00 | $1.50 |
| claude-sonnet-4-5 | $3.00 | $15.00 | $0.30 |
| gemini-2.5-pro | $1.25 | $10.00 | — |
The cost formula (src/lib/usage/costCalculator.ts):
cost = (prompt_tokens - cached_tokens) * input_price + cached_tokens * cached_price + completion_tokens * output_price;Why subtract cached from prompt? The cached portion is priced separately; charging input price on the whole prompt would over-count.
Pricing Sync
Section titled “Pricing Sync”Pricing data is auto-synced from LiteLLM via the /api/pricing/sync endpoint (triggered by the built-in cron task, not a user-facing env var):
# Manual triggercurl -X POST http://localhost:20128/api/pricing/syncFor models with no pricing data, OmniRoute falls back to estimating cost using internal average rates (sourced from LiteLLM’s pricing data).
Date Range Aggregation
Section titled “Date Range Aggregation”The usageAnalytics.ts module computes dashboard widgets from raw usage data. It supports 7 time ranges:
| Range | Window | Use case |
|---|---|---|
1d |
Last 24 hours | Hourly cost spike detection |
7d |
Last 7 days | Weekly review |
30d |
Last 30 days | Monthly billing |
90d |
Last 90 days | Quarterly analysis |
ytd |
Since Jan 1 of current year | Annual budget tracking |
all |
All time | Lifetime stats |
custom |
User-defined start/end | Audits, ad-hoc queries |
Dashboard Widgets Computed
Section titled “Dashboard Widgets Computed”For any date range, the analytics layer computes:
| Widget | Description |
|---|---|
| Summary cards | Total requests, total cost, total tokens, success rate |
| Daily trend chart | Cost + tokens per day, stacked by model |
| Activity heatmap | Hour-of-day × day-of-week grid, color = request count |
| Model breakdown | Pie chart of cost by model |
| Provider breakdown | Bar chart of requests by provider |
| Top API keys | Table of top 10 keys by cost |
| Error analysis | Error rate over time, top error classes |
Programmatic Access
Section titled “Programmatic Access”import { computeAnalytics } from "@/lib/usageAnalytics";
const analytics = await computeAnalytics( history, // usage history records "7d", // time range: "1d" | "7d" | "30d" | "90d" | "ytd" | "all" | "custom" connectionMap, // provider connection map (connectionId → account name) { startDate: "2025-01-01", // optional: for "custom" range endDate: "2025-06-01", // optional: for "custom" range });
console.log(analytics.summary.totalCost); // 12.34 (cents)console.log(analytics.byModel[0]); // { model, cost, requests, promptTokens, completionTokens }
---
## Quota Enforcement
Per-API-key quota is enforced in two places:
1. **Soft limit** (`quotaWarnAt`): dashboard warning when usage exceeds threshold2. **Hard limit** (`quotaLimit`): request rejected with HTTP 429 when exceeded
### Configuration
```ts// Per API keyawait updateApiKey(keyId, { quotaWarnAt: 5_00, // $5.00 — show warning quotaLimit: 10_00, // $10.00 — hard stop quotaWindow: "month", // "day" | "week" | "month" | "all"});Enforcement Flow
Section titled “Enforcement Flow”Request ──▶ quotaCheck() │ ├── Within limit? ──▶ allow │ └── Over limit? ──▶ 429 Too Many Requests with Retry-After headerQuota Snapshots
Section titled “Quota Snapshots”quotaSnapshots table stores historical quota state for trend analysis:
| Field | Description |
| ———– | –––––––––––––––– | —— | —–– |
| apiKeyId | The key being tracked |
| window | “day” | “week” | “month” |
| used | Cost used in this window (cents) |
| limit | The limit (cents) |
| resetAt | When the window resets |
| createdAt | When the snapshot was taken |
Snapshots are taken on every request that uses > 0 cost, and used to:
- Render the quota progress bar in the dashboard
- Show 30-day quota trend charts
- Trigger alerts when usage approaches the limit
REST API
Section titled “REST API”List Usage Records
Section titled “List Usage Records”GET /api/usage?range=7d&limit=100GET /api/usage?apiKeyId=key-123&range=30dGET /api/usage?provider=openai&range=1dResponse:
{ "records": [ { "id": "uuid", "apiKeyId": "key-123", "provider": "openai", "model": "gpt-5", "promptTokens": 1234, "completionTokens": 567, "totalTokens": 1801, "costUsd": 0.005, "latencyMs": 1234, "status": "success", "timestamp": "2026-06-08T12:00:00Z" } ], "total": 1234, "nextCursor": "..."}Get Analytics Summary
Section titled “Get Analytics Summary”GET /api/usage/analytics?range=7d&groupBy=modelResponse:
{ "summary": { "totalCost": 12.34, "totalRequests": 5678, "totalTokens": 12345678, "successRate": 0.987, "avgLatencyMs": 1234 }, "models": [ { "model": "gpt-5", "cost": 8.5, "requests": 1234, "tokens": 4567890 }, { "model": "claude-opus-4-6", "cost": 3.84, "requests": 234, "tokens": 234567 } ], "daily": [ { "date": "2026-06-01", "cost": 1.5, "requests": 800 }, { "date": "2026-06-02", "cost": 2.0, "requests": 1000 } ]}Query Usage Analytics
Section titled “Query Usage Analytics”Usage data is accessed via the dashboard or MCP tools, not direct REST export endpoints. Available analytics:
/api/usage/analytics— aggregated usage metrics (group by model, provider, key)/api/usage/quota— current quota status per API key/api/usage/history— request history logs
MCP Tools
Section titled “MCP Tools”Two MCP tools expose usage data to agents (see open-sse/mcp-server/tools/):
| Tool | Description |
|---|---|
omniroute_cost_report |
Generates a per-key cost report for a given period |
omniroute_check_quota |
Returns current quota status for an API key |
Example agent invocation:
{ "tool": "omniroute_cost_report", "args": { "period": "week" }}Retention and Cleanup
Section titled “Retention and Cleanup”Usage data grows ~1-10KB per request. At scale, this can be significant.
Retention Settings
Section titled “Retention Settings”Usage history retention is configured via the Database Settings in the UI or via /api/settings/database.
By default, usage history is retained for 90 days.
Cleanup
Section titled “Cleanup”Old records are cleaned up by src/lib/db/cleanup.ts:
- Triggered by the background cron process
- Deletes records from
usage_historyolder than the configuredusageHistoryretention setting
Storage Estimation
Section titled “Storage Estimation”| Request rate | 30-day storage | 90-day storage |
|---|---|---|
| 100 req/day | ~3MB | ~9MB |
| 1,000 req/day | ~30MB | ~90MB |
| 10,000 req/day | ~300MB | ~900MB |
| 100,000 req/day | ~3GB | ~9GB |
For very high traffic, consider:
- Reducing the retention period via Database Settings
- Using
aggregated_metricsinstead of raw records (only for analytics)
Cost Optimization Tips
Section titled “Cost Optimization Tips”1. Use the Right Model
Section titled “1. Use the Right Model”# Quick answer — use cheap + fastcurl -d '{"model":"auto/fast","messages":[...]}'
# Complex task — use qualitycurl -d '{"model":"auto/smart","messages":[...]}'2. Enable Caching
Section titled “2. Enable Caching”Anthropic prompt caching saves 90% on repeated context:
// The caching is automatic — just include the same large system promptconst response = await openai.chat({ model: "claude-sonnet-4-5", system: longSystemPrompt, // Will be cached automatically messages: [{ role: "user", content: "..." }],});3. Use Compression
Section titled “3. Use Compression”RTK + Caveman compression saves 15-95% on tool-heavy sessions:
const config = { compression: { engine: "rtk", intensity: "aggressive", },};4. Set Per-Key Quotas
Section titled “4. Set Per-Key Quotas”Always set quotaLimit to prevent runaway costs:
await updateApiKey(keyId, { quotaLimit: 10_00 }); // $10/month cap5. Audit Top Consumers
Section titled “5. Audit Top Consumers”Use the dashboard or /api/usage/analytics to group by API key and sort by cost:
GET /api/usage/analytics?groupBy=apiKeyTroubleshooting
Section titled “Troubleshooting”“Cost is higher than expected”
Section titled ““Cost is higher than expected””- Check
/api/usage/analytics?groupBy=model— find the expensive model - Check
/api/usage/analytics?groupBy=apiKey— find the heavy consumer - Verify pricing data is up to date:
POST /api/pricing/sync
“Records missing”
Section titled ““Records missing””- Check DB retention settings under Dashboard → Database → Cleanup — old records are deleted by the periodic cleanup task (
src/lib/db/cleanup.ts) - Check for errors in
src/lib/db/usage*.ts— DB write failures are logged but not surfaced - Verify the request actually reached
chatCore— check combo routing
“Quota not enforcing”
Section titled ““Quota not enforcing””- Check the key’s
quotaLimitsetting - Verify
quotaWindowis set correctly - Look for
quotaSnapshotsrecords — they should be created on every request
See Also
Section titled “See Also”- DATABASE_GUIDE.md — Schema for usage tables
- ENVIRONMENT.md — pricing sync env vars
- AUTO-COMBO.md — How
auto/fast,auto/cheapreduce cost - API_REFERENCE.md — Full
/api/usage/*reference - Source:
open-sse/services/usage.ts,src/lib/usageAnalytics.ts,src/lib/db/usage*.ts
HagiCode
HagiCode is an agentic coding workspace: structured workflows, multi-agent execution, and Hero Dungeon views turn ideas into shipped software.
Turn ideas into polished, usable software with a smarter, faster, and more enjoyable agentic coding workflow.
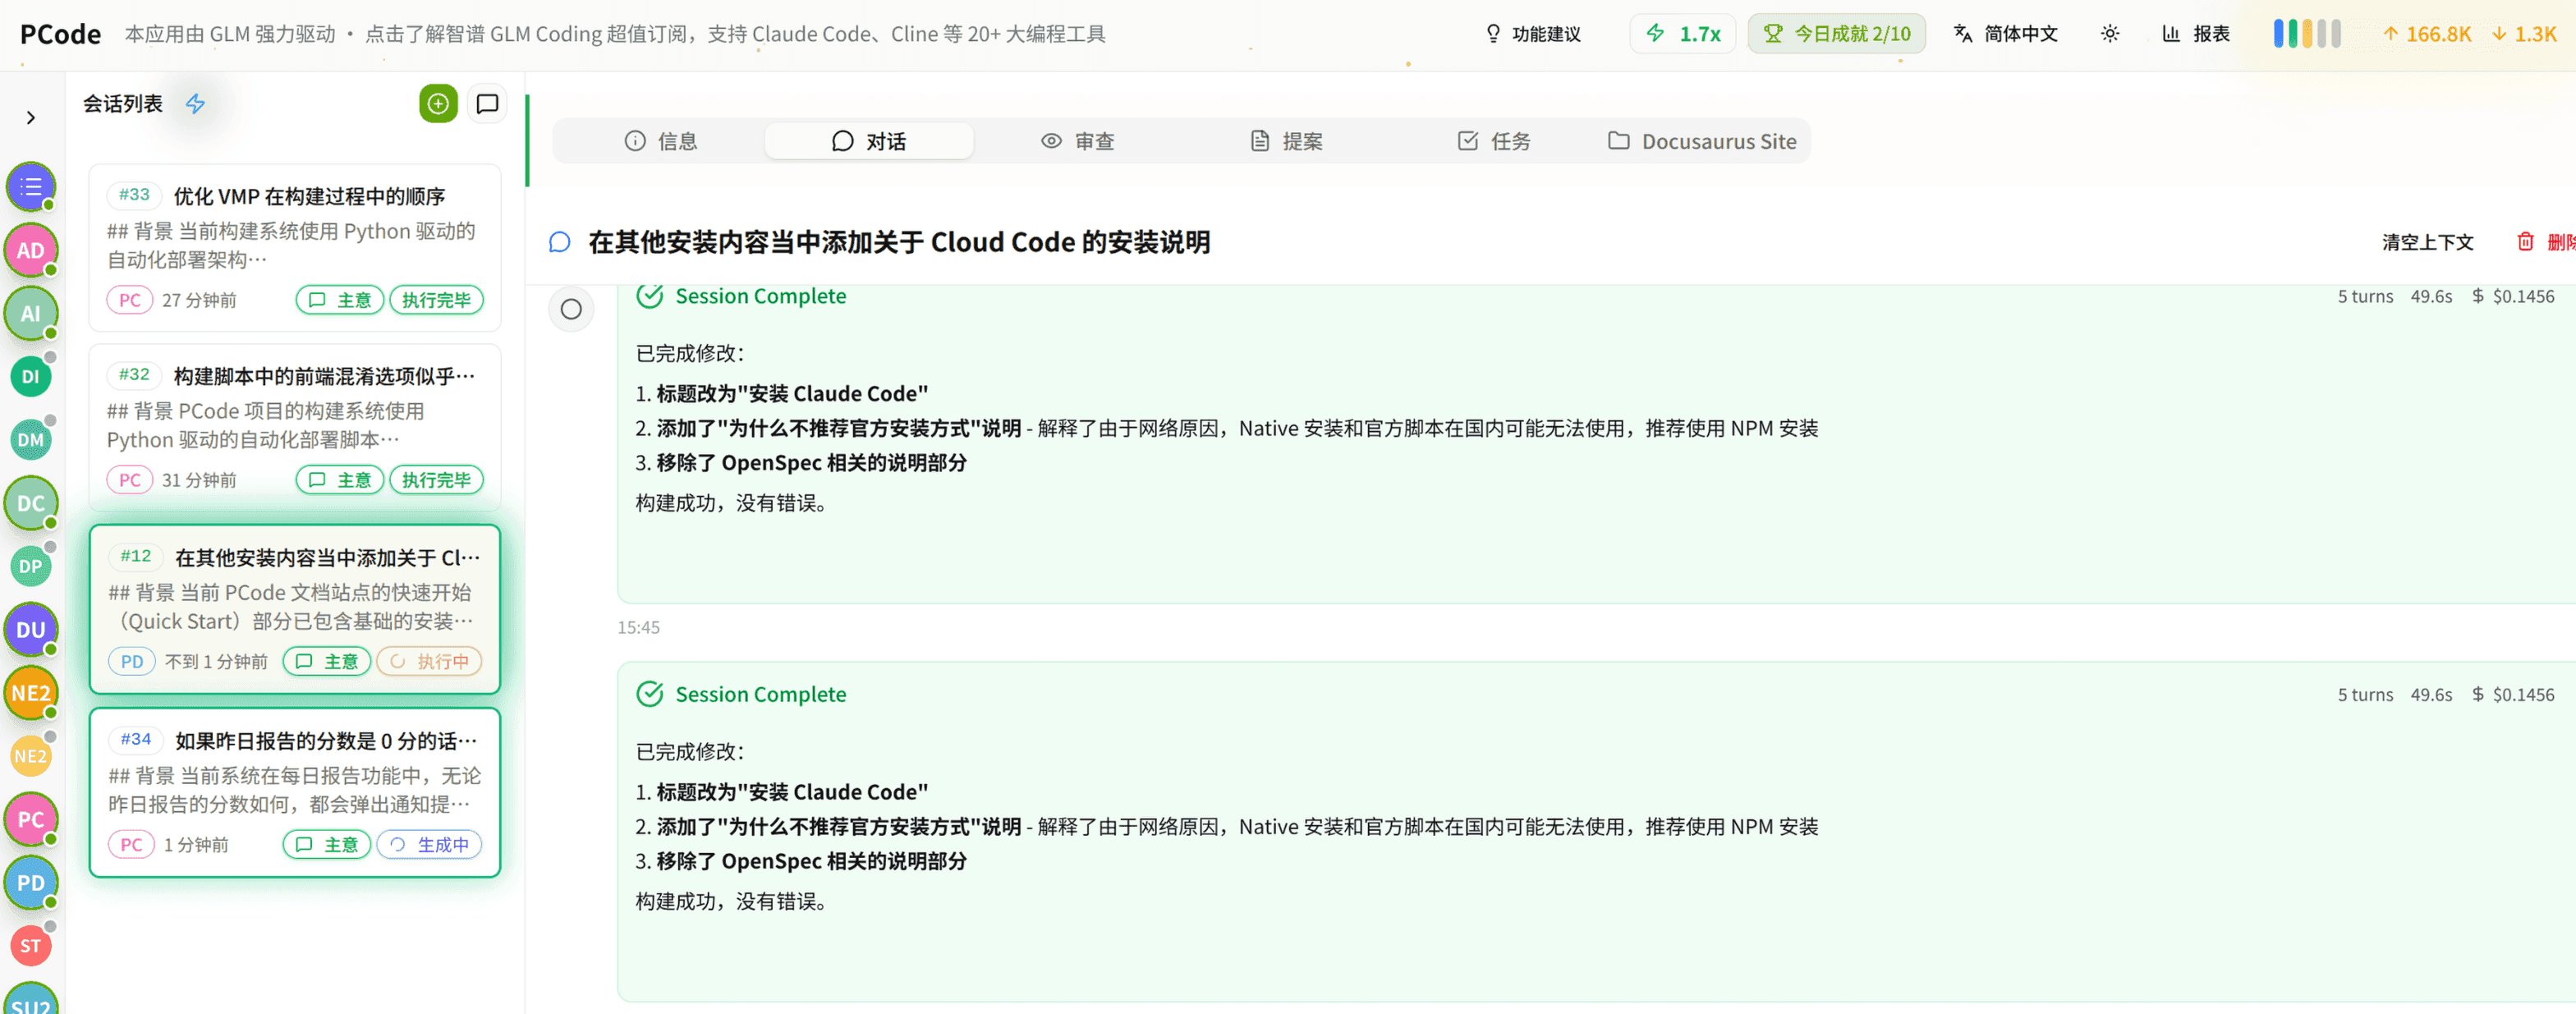
- SmartStructured workflows turn intent into an executable path from idea to shipped change.
- EfficientMulti-agent workflows keep research, implementation, and review moving in parallel.
- FunHero Dungeon interfaces make long coding sessions visual, collaborative, and rewarding.